

NALP Bulletin, April 2021
While apples-to-apples comparisons are not always possible, data from NALP's annual Employment Report & Salary Survey (ERSS) have provided some key insights into employment and salary outcomes for law school graduates. As we celebrate NALP's 50th Anniversary in 2021, it's important to look back at the ways the ERSS has evolved through the years, while examining some of the stark realities that this ongoing data collection has allowed us to document — specifically the persistent gaps in employment outcomes by race and ethnicity.
ERSS Origin Story: 1973
Back in September 1973, placement directors at NALP member law schools received a letter dated September 11 from the newly appointed chair of NALP's Research Committee. The letter read in part:
"It is obvious to all of us that questions regarding the job market for lawyers are being asked by many people. Questions commonly asked include: are there presently too many lawyers or is there a need for more? …Though we have all developed 'form' responses to such questions I know that I would feel more confident if I had better data upon which to formulate an opinion. The Research Committee and all the officers of NALP believe that the first step law school placement offices should and can take is to standardize the in-house data gathering process so that each school is keeping similar kinds of statistics in similar form…. Each of us will then be able to better assess the activities of our individual placement offices and provide…more uniform placement information and estimates regarding the law placement market…. I am asking first that you…complete the enclosed questionnaire. The questions are designed to determine what data each law school has been gathering in the past and the format used. We are particularly interested in the most current and complete data you have on 1973 law graduates. Second, it is essential that you begin to use the format set forth in Enclosure A in keeping statistics on the jobs accepted by seniors graduating during the coming 1973-74 school year…."
According to the results of that survey — completed by 119 schools and presented at the NALP Annual Conference in June 1974 — 69% of schools kept statistics on post-graduate employment, and of those who did not, about half said they would be able to gather such information for the 1974-75 academic year. That report was not formally published, nor were employment findings for the Class of 1973 based on about 70 schools which completed "Enclosure A." And in fact, I had never seen any report on the Class of 1974; tidbits — particularly on employer types — were gleaned from later published ERSS reports.
However, after rummaging around in NALP files, I found the report on the Class of 1974, which was disseminated to all NALP members in October 1975 in the form of a three-page memo from the chair of the Research Committee. The memo, reporting aggregate counts only, noted that 83 schools, with a total of 17,188 graduates in the Class of 1974, had reported on 13,250 graduates, of whom 11,679 reported employment. (See the original survey here.)
Percentages for employer type were calculated separately, based on approximately 5,600 graduates for whom employer type was known, and noted in later published reports. So began the employer-type trend table that has continued since, with some definitional changes, such as how graduates pursuing graduate studies are classified.
More interesting perhaps are the early discussions about how to define employment and unemployment. As the memo on the Class of 1974 noted, "Since there was no place to indicate the number of graduates who were not seeking employment, we were not able to ascertain if placement directors recorded them under 'unemployed' or 'employed.'" The survey for the next year (1975) included a supplemental survey, requesting information on, among other things, under what circumstances a school considered a graduate unemployed. Findings were included in the report for the Class of 1975 and are illustrated below.
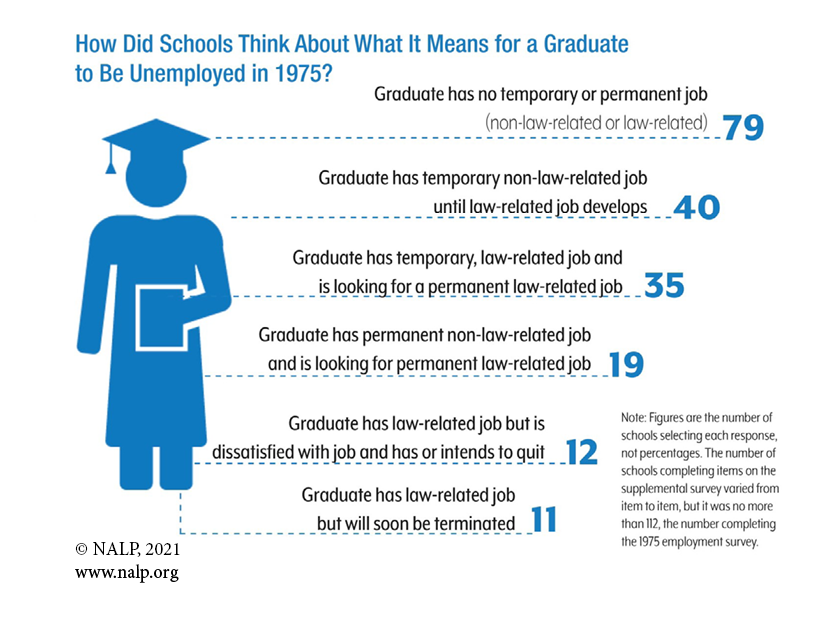
The report noted the need for better definitions, distinguishing, for example, the status of a graduate who has a temporary but law-related job from the graduate who is a clerk in a grocery store — the equivalent to today's stereotype of barista or Uber driver. The committee further queried as to whether graduates who had not passed the bar exam should even be considered as being in the job market, and that perhaps there should be a category for such graduates on the survey for the Class of 1976.
Given the ambiguities of how "employed" was defined, we really can't draw a trend line on that most basic measure back to the early days of the data collection. Further, counts of jobs by category very likely did not count all grads who by more recent definitions would be considered as employed. Finally, with no distinctions as to kind of job — legal, other professional, etc. — those old waters are further muddied.
Class of 1976
The survey for the class of 1976 codified new categories for graduates who are eligible to be employed because they have passed a bar exam and for those who are not eligible. Graduates who were eligible could be reported as either "employed," or "still seeking employment" and were "above the line." (Presumably, those employed could be in a non-legal position, but this was not explicit until the 1982 survey.) The other categories were "qualified but not seeking employment" and "did not take/pass bar exam" and were "below the line."
By the calculations of the day, only graduates above the line were included when calculating the employment rate, which worked out to 92% that year. But if the figures are re-calculated to include all grads with known status in the denominator, the rate works out closer to 87%. But among those reported as "not taken/passed a bar exam," some likely were employed and would add a few percentage points to what we think of today as the employment rate.
Class of 1982
This scheme continued through reporting for the class of 1982. However, the employed category was refined to distinguish legal and non-legal employment, as well as full-time and part-time employment. (The 1981 reporting had separated business jobs only into legal and non-legal.) The reporting for the class of 1983 dropped the concept of eligibility and graduates could be reported as employed (full-time/part-time/legal/non-legal), pursuing advanced degree full-time, unemployed and seeking, or unemployed and not seeking. Prior to 1983, graduate students had been reported as employed in academia. The employer type categories were also re-worked in places to look more like what we are familiar with today.
Also of note: for the first six years of data collection from 1974 to 1980, schools did not submit information for individual graduates. Instead, schools reported aggregate counts for each of the categories. Schools additionally reported, if they could, aggregate figures for men, women, and minorities in each of the categories, and counts of jobs by state and counts for a list of cities. Supplemental salary information was collected for 1979 and 1980.
The procedure changed for the Class of 1981, with the introduction of Scantron (aka bubble) forms completed for individual graduates. The advent of computerized processing facilitated larger reports, and indeed that is what happened. The report on the Class of 1980 came in at just over 100 pages, all typed. The report ballooned to about 465 pages for the Class of 1988. But quantity did not necessarily equate with quality, as computer printouts went on for pages with overall benchmarks hard to find.
Classes of 1989 and 1990
With the classes of 1989 and 1990, the number of pages dropped. When NALP hired its first research staff and Publications Manager Janet Smith, the report on the Class of 1989 was reduced to just over 90 pages, with graphs and formatted tables and text instead of printouts. Data processing and analysis also gradually came in-house to NALP during the 1989-91 period, with the last contracted analysis being preparation in early 1992 of school reports for the Class of 1990.
Finally, also missing from early data collection was any guidance on an "as of" date. The timing of reporting to NALP was generally in the January-February period, which suggests that schools would be gathering data in a time period approximately six months after a May graduation.
The first mention of a timeline — "six months post-JD" — appeared in the Class of 1989 report, but more explicit guidance did not appear until data collection instructions for the Class of 1996, which stated "up to but no more than six months after graduation." The as-of date was pinpointed as February 15 for the Class of 1997 and adjusted to March 15 starting with the Class of 2014.
How Have Employment Outcomes Varied by Race and Ethnicity Data
We have had, for almost all of NALP's 50-year history, at least some information about what law school graduates do once they graduate and — generally — become licensed to practice law. Published annually for 45 years, our series of reports provides many answers. But as a contribution to NALP's recent commitment to use its data to document racial disparities in the legal profession, I have compiled trends in selected metrics by race and ethnicity. Some of these figures have appeared in earlier publications, others were compiled specifically for this column.
Arguably the most basic metrics are: are graduates employed and to what extent are they employed in a job that can be characterized as "legal" in nature? What kinds of employers do graduates work for? And, how large are the law firms for those graduates who enter private practice? Here are some takeaways from analyzing the report over the years:
Lessons Learned from ERSS Data
The employment market for new law school graduates has proved to be quite consistent over time, particularly in terms of the kinds of employers — some well-documented disrupters notwithstanding. Employment rates overall and in legal positions have gone up and down. The market has also proved itself quite consistent over time in terms of contrasts between different racial/ethnic groups on these measures, despite larger macro-economic and demographic trends. Where this goes in the future, only time can tell.
Table 1: Employment in Selected Sectors, by Race/Ethnicity, Selected Years, 1987-2019

Table 2: Percent of Law Firm Jobs by Size of Firm and Race/Ethnicity for Selected Years, 1987-2019

Chart 1: Percent of Jobs Taken in Law Firms (By Graduate Race/ethnicity, selected years 1987-2019)

Chart 2: Overall Employment Rate (By Graduate Race/ethnicity, selected years 1987-2019)

Chart 3: Employment in Legal Jobs (By Graduate Race/ethnicity, selected years 1987-2019)


