

NALP Bulletin, December 2019
NALP has been collecting data on law graduates who identify as transgender within the annual Employment Report and Salary Survey (ERSS) since 2014. While the number of graduates self-identifying as transgender each year has been relatively small and prevents inclusion within the more detailed tables and analyses contained in NALP's Jobs & JDs publication, we can explore some general trends in employment and demographics more broadly for transgender law school graduates. The data presented in this article come from the Classes of 2015-2018. (The number of graduates identifying as transgender in 2014, the first year of data collection, was very low at only 15; therefore, this class year has not been included in this analysis. In subsequent years at least 20 transgender graduates were reported.) The number of graduates self-identifying as transgender and the number of schools reporting transgender graduates has increased during this period of time. In 2015, there were 22 transgender graduates reported at 21 schools. In 2018, these numbers rose to 35 transgender graduates at 28 schools. Due to the manner in which data on transgender graduates are collected, NALP is unable to determine how many schools surveyed their graduates regarding transgender identity, but did not have any students that self-identified as transgender.
Employment Settings:

As can be seen in Table 1, graduates who identify as transgender are about twice as likely as the overall graduate population to take public service jobs, which includes jobs in government, public interest, and judicial clerkships. This overrepresentation in public service is being driven almost entirely by public interest employment. For example, for the Class of 2018, 30.5% of employed law school graduates overall were in public service roles compared to 58.1% of transgender graduates. These differences are even more substantial when looking at public interest positions specifically — where Class of 2018 transgender grads are over four times as likely to be employed than the general law graduate population (32.3% vs. 7.4% overall).
Demographics:
There were a number of key findings when exploring demographic differences between transgender graduates and the overall law school graduate population.

Graduates who identified as transgender were much more likely to report having a disability. With the exception of the Class of 2017, the proportion of transgender graduates reporting a disability ranged from about 1 in 5 to 1 in 3 for the Classes of 2015-2018. In comparison, the percentage of graduates overall that reported having a disability ranged from only 2.6% to 3.5% during this time period. While NALP does not collect more detailed data on the types of disabilities that law graduates have, a 2018 white paper regarding the student experiences of queer- and trans-spectrum undergraduate students from Rutgers' Tyler Clementi Center finds that trans-spectrum students report much higher rates of depression, anxiety, self-injury, and suicide ideation and/or attempts throughout their undergraduate education than non-transgender students.
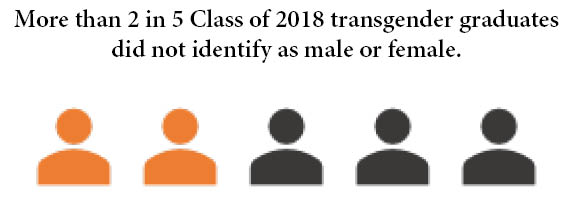
Not surprisingly, graduates who identified as transgender were also much more likely to select the "I do not identify as male or female" gender identity option. The percentage of trans graduates selecting this option ranged from 28.6% to 47.6% for the Classes of 2015-2018. In comparison, just 0.10% to 0.24% of graduates overall identified as neither male or female.
Transgender graduates were more inclined to report being gay, lesbian, or bisexual or to select the "other" option for sexual orientation. The proportion of gay, lesbian, or bisexual trans graduates ranged from about 1 in 3 to 1 in 2 for the Classes of 2015-2018. The percentage of transgender graduates reporting "other" for sexual orientation ranged from 30.0% to 41.4% during this time period.
In light of the uncertainty surrounding the current transgender military ban, it is also worth noting that for the Class of 2018 there were two transgender U.S. military veterans reported and one transgender veteran reported for the Class of 2017.
Top Job Locations:
New York City was a top location for transgender graduates for the past four years. At least two graduates from each of the 2015-2018 classes reported taking a job in New York City. For trans graduates with a known job location, New York City accounted for 7.7% to 20.0% of jobs during this time period. Washington, DC and San Francisco were both top locations in 2016 and 2018. Chicago accounted for almost 1 in 5 jobs with a known location taken by transgender graduates for the Class of 2017. See Table 2.
Important Caveats:
While this information can help us learn more about the demographics and employment outcomes of transgender graduates, it is important to understand the limitations of these data. For the Class of 2018, just 0.1% of graduates self-identified as transgender. The Williams Institute estimates that 0.6% of the U.S. population is transgender, which suggests a few possible scenarios: a). many law schools are still not gathering data about transgender identity; b). some students and graduates are not comfortable disclosing their transgender identity to their school; and/or c). transgender individuals may be underrepresented in law school. If certain types of law schools or populations of law students are less likely to collect/share these data, NALP's data may not be representative of the true population of transgender law graduates. Nonetheless, these data help to provide us with some general insights into the demographic profile and employment sector preferences of transgender graduates.
Table 1. A Comparison of Employer Types — Classes of 2015-2018
Transgender Graduates vs. All Graduates
| Sector | OF THOSE EMPLOYED, % IN EACH EMPLOYER TYPE | ||||
| 2015 | 2016 | 2017 | 2018 | ||
| Private Practice | Transgender Graduates | 25.0% | 18.8% | 30.8% | 32.3% |
| All Graduates | 51.3 | 52.9 | 54.4 | 54.8 | |
| Business | Transgender Graduates | 10.0 | 6.3 | 11.5 | 6.5 |
| All Graduates | 17.2 | 15.6 | 13.9 | 12.9 | |
| Education | Transgender Graduates | 0.0 | 6.3 | 0.0 | 3.2 |
| All Graduates | 1.9 | 1.9 | 1.6 | 1.6 | |
| Government | Transgender Graduates | 5.0 | 12.5 | 7.7 | 12.9 |
| All Graduates | 12.3 | 12.1 | 12.0 | 11.9 | |
| Judicial Clerkships | Transgender Graduates | 20.0 | 12.5 | 11.5 | 12.9 |
| All Graduates | 10.0 | 10.5 | 10.7 | 11.2 | |
| Public Interest | Transgender Graduates | 40.0 | 43.8 | 38.5 | 32.3 |
| All Graduates | 7.1 | 6.9 | 7.2 | 7.4 | |
| Total – All Public Service* | Transgender Graduates | 65.0 | 68.8 | 57.7 | 58.1 |
| All Graduates | 29.4 | 29.5 | 29.9 | 30.5 | |
*All public service includes jobs in government, public interest, and judicial clerkships.
Note: Percentages for all graduates may not add up to 100 because the unknown employer type is not included in this table. There were no transgender students with an unknown employer type reported during this time period.
Table 2: Top Job Locations* for Transgender Graduates
| City | % of Transgender Graduates with a Known Job Location Reported | |||
| 2015 | 2016 | 2017 | 2018 | |
| Chicago | NA | NA | 19.2% | NA |
| New York City | 20.0% | 12.5% | 7.7% | 9.7% |
| San Francisco | NA | 12.5% | NA | 6.5% |
| Seattle | NA | NA | NA | 6.5% |
| Washington, DC | NA | 12.5% | NA | 12.9% |
* Top job locations are those with at least two transgender graduates reported.
NA: Not applicable/less than two graduates reported.


