NALP Bulletin, July/August 2019
As summer programs wind down and fall recruiting begins, the topics of target sizes for the next year's summer program and of how to achieve those targets and desired yields may become subjects of discussion. NALP research has long documented summer program sizes and outcomes, as well as the level of fall recruiting activity for 2Ls and those outcomes, in annual Perspectives on Law Student Recruiting reports. We know, for example, that offer acceptance rates rose to close to or above 40% during the recession, compared to about 30% in more prosperous times. Likewise, recruiting volumes, measured by callback invitations, have fluctuated.
There is an additional question that NALP's research can answer: How many callback interviews are needed to result in one accepted offer for the summer program? This question was most recently explored in an August 2017 NALP Bulletin column, and the answer remains largely the same as reported two years ago: While dipping just slightly over the last two years (from 5.7 to 5.4 callback interviews needed), the number has remained surprisingly steady even as recruiting volumes, acceptance rates, and summer class sizes have varied. As shown in Table 1, which compiles a selection of fall recruiting measures for the 20 most recent recruiting seasons (a period which includes a wide range of economic conditions), the number of callback interviews needed to result in one accepted offer has, with a few exceptions, been in the 5-6 range overall.
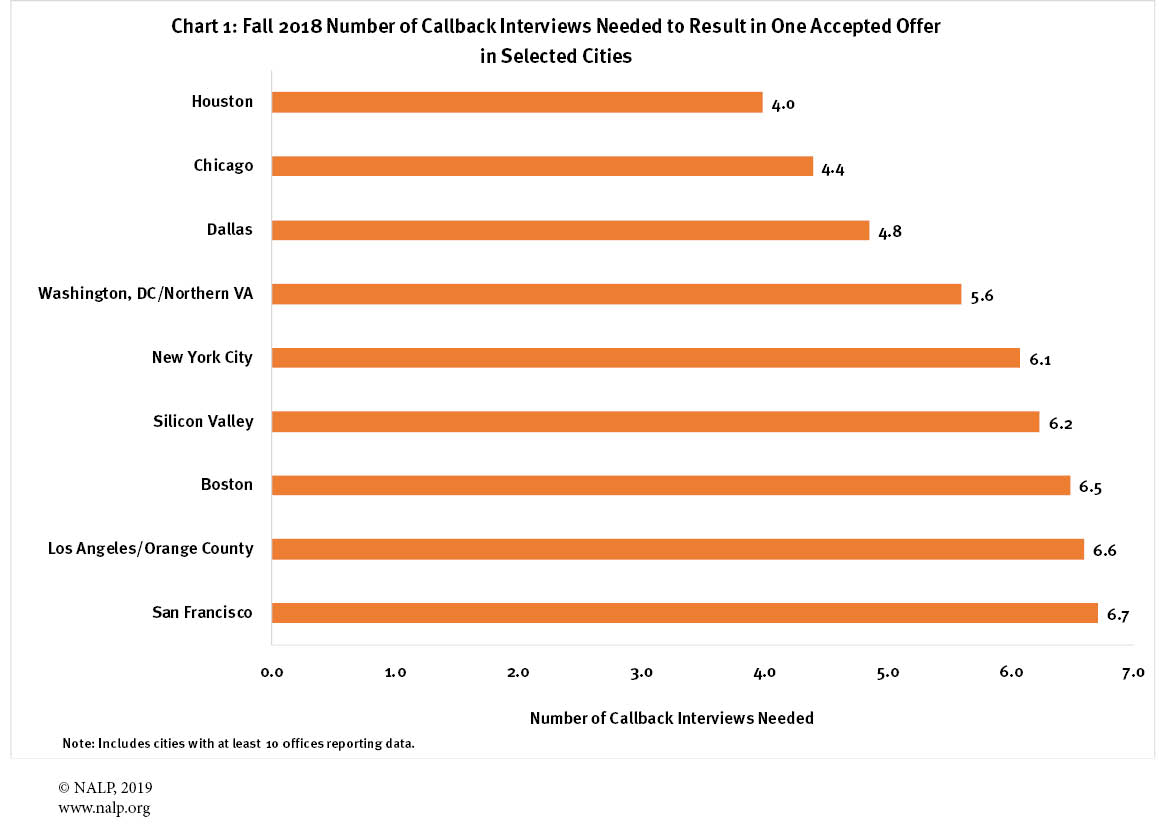
Of course, these figures are averages and reflect survey responses for each year across a range of firm sizes, but nonetheless they offer a metric that has been remarkably stable. And although acceptance rates vary by firm size, with the aggregate acceptance rate generally higher at smaller firms, the callback interview ratio in fall 2018 varied only from 5.2 to 5.7, with figures of 5.2 to 5.4 in most firms except at firms of 100 or fewer lawyers (5.7). Regionally, there was much more variability — with firms in the Midwest having the smallest number of callback interviews needed (4.5) compared to 6.1 callback interviews needed in the West/Rocky Mountain region, which had the highest number needed. Information for selected cities is presented in Chart 1. Of those cities with at least ten offices reporting data, Houston had the lowest number of callback interviews needed to result in one accepted offer (4.0) and San Francisco had the highest (6.7).
As further evidence of the overall stability of this measure, one can compare it to the number of jobs in firms of more than 100 lawyers taken by new graduates — an approximate proxy for the total number of summer associates recruited two years prior — for the class year with the largest such number and more recent classes with a smaller number. For example, Class of 2008 grads took almost 8,500 jobs in firms of this size; during the fall of 2006 when these grads would have been recruited for the summer program, the ratio was 5.7. The Class of 2013 found about 2,400 fewer such jobs, yet during fall 2011 recruiting, the ratio was 5.8. Likewise, the Class of 2017 found about 1,900 fewer such jobs than the Class of 2008, yet during fall 2015 recruiting, the ratio was the same — 5.7.
It may be worthwhile for individual law offices to compare trends over time in their own recruiting ratios — that is, how many callback interviews were required to yield one accepted offer for the summer program. For individual offices the actual number may be higher or lower than the national figures, but if there are significant variations in the ratio year over year or there are interruptions in the pattern, it may be useful to attempt to identify the factors or unique circumstances that caused changes. For example, as noted in student responses and comments from NALP's "Survey for Law Students Who Interviewed with Law Firms for Summer 2019," the people that they met during OCI were very influential on students' final decisions about whether and where to accept and reject summer employment offers. Attempting to identify and address the factors impacting your recruiting ratios can assist in re-stabilizing or even improving your recruitment outcomes.
Table 1. Selected Measures of Fall Recruiting for Summer Programs
| Recruiting During Fall: | Number of Callback Invitations | % of Callback Invitations Accepted | % of Offers Accepted | # of Callback Interviews Needed to Result in One Accepted Offer | |
| Median | Average | ||||
| 2018 | 35 | 89 | 77.0% | 34.9% | 5.4 |
| 2017 | 39 | 93 | 78.5 | 34.4 | 5.6 |
| 2016 | 38 | 94 | 76.9 | 33.2 | 5.7 |
| 2015 | 39 | 92 | 77.5 | 32.7 | 5.7 |
| 2014 | 35 | 87 | 77.2 | 33.8 | 5.7 |
| 2013 | 30 | 74 | 78.1 | 35.4 | 6.0 |
| 2012 | 30 | 58 | 79.2 | 38.2 | 5.9 |
| 2011 | 33 | 61 | 77.5 | 37.1 | 5.8 |
| 2010 | 29 | 57 | 80.9 | 40.4 | 6.2 |
| 2009 | 30 | 53 | 83.5 | 42.8 | 6.4 |
| 2008 | 40 | 86 | 73.9 | 32.5 | 6.6 |
| 2007 | 46 | 93 | 72.2 | 29.1 | 5.7 |
| 2006 | 42 | 82 | 72.7 | 28.8 | 5.7 |
| 2005 | 48 | 86 | 72.3 | 30.3 | 5.5 |
| 2004 | 42 | 82 | 75.8 | 31.2 | 5.7 |
| 2003 | 37 | 74 | 77.7 | 31.4 | 6.0 |
| 2002 | 33 | 60 | 78.5 | 35.1 | 5.7 |
| 2001 | 36 | 66 | 77.0 | 34.9 | 5.6 |
| 2000 | 55 | 95 | 73.0 | 31.0 | 5.2 |
| 1999 | 53 | 87 | 74.7 | 29.0 | 5.4 |
Source: NALP, Perspectives on Law Student Recruiting, 1999-2018, and additional compilations.