NALP Bulletin+
November 2026
When comparing compensation across cities, the salary figure alone doesn’t tell the whole story. The relative buying power of the U.S. dollar in a location and how far a new law graduate’s paycheck will stretch is an important consideration as well. For example, a law student choosing between Washington, DC and San Francisco might wonder: Which city provides greater purchasing power? A location with stronger buying power can offer greater lifestyle flexibility, more discretionary income, and the opportunity for new lawyers to reach personal milestones, such as paying off student debt, purchasing a home, or starting a family, faster. NALP’s latest update of our Buying Power Index (BPI) for the Class of 2025 offers comparative analyses for 105 cities, helping users evaluate how far a salary goes in each location. The full index is available at www.nalp.org/class_of_2025_buying_power_index.
Within this resource, NALP has analyzed salary data from the Class of 2025 Employment Report and Salary Survey in conjunction with cost-of-living data from the Council for Community & Economic Research (C2ER) to rank cities based on a Buying Power Index, which illustrates purchasing power differentials. The BPI was calculated using New York City’s Class of 2025 median private practice salary and its cost of living as a benchmark. Thus, New York City’s BPI is 1.00. BPIs for other cities demonstrate how much buying power the median law firm salary for the Class of 2025 in that location provides compared with the New York City median.
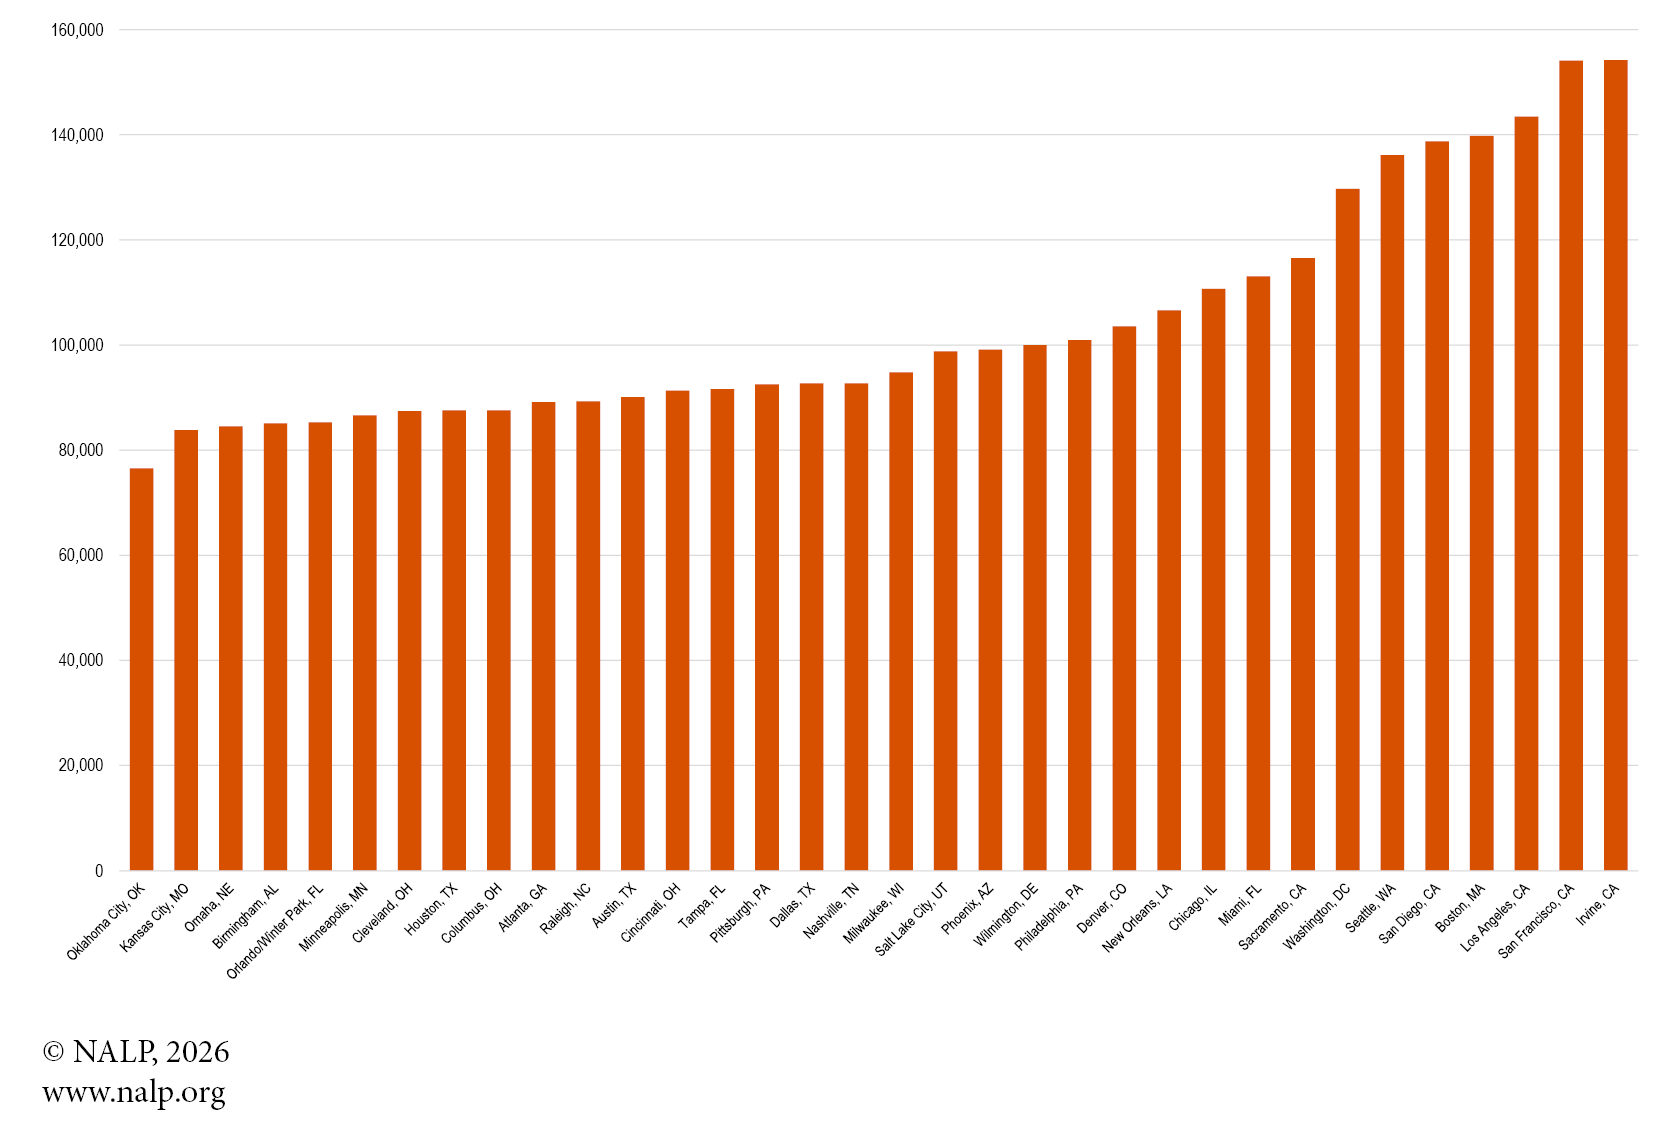
Table 1 shows the BPI for the 35 cities in which at least 50 law firm salaries were reported for the Class of 2025, and for which cost-of-living information was available. Those cities with a BPI greater than 1.0 offer more purchasing power compared to New York City and those with a BPI below 1.0 provide less purchasing power. Chart 1 displays the amount a graduate would need to earn in each city to yield the same purchasing power of a $225,000 salary in New York City.
When buying power is considered for the Class of 2025, all but one of these cities, San Diego, are more affordable than New York City. Houston, TX remained the city with the greatest buying power — a position it has held in every edition of NALP’s BPI since the Class of 2016. In some cities, including Orlando, FL and Omaha, NE, the median law firm salary was less than half of New York City’s $225,000 median, yet those cities still offered more purchasing power due to their lower costs of living.
The complete Buying Power Index on NALP’s website includes all 105 cities for which at least ten law firm salaries were reported for the Class of 2025, and for which cost-of-living information was also available. I encourage you to explore this resource to learn much more about buying power comparisons and the variety of ways in which you can use them. For example, study how to compare similar salaries in any two cities with different BPIs, or discover how you can use the BPI to calculate the relative buying power for any salary in a city (not just the median) with that of New York City. This is a valuable resource to share with students and recent graduates who are considering job opportunities in more than one location.
You can also learn more about how entry-level law firm salaries vary by location in Jobs & JDs: Employment and Salaries of New Graduates, Class of 2025, available in the NALP bookstore.
Table 1. Class of 2025 Buying Power Index for Cities with at Least 50 Law Firm Salaries Reported
| City | Class of 2025 Median Law Firm Salary ($) | Salary ($) Required to Yield
New York City Buying Power | Buying Power Index | # of Law Firm Salaries Reported |
| Houston, TX | $225,000 | $87,552 | 2.570 | 410 |
| Dallas, TX | 215,000 | 92,730 | 2.319 | 344 |
| Minneapolis, MN | 187,500 | 86,611 | 2.165 | 136 |
| Austin, TX | 190,000 | 90,094 | 2.109 | 122 |
| Wilmington, DE | 210,000 | 99,979 | 2.100 | 78 |
| Chicago, IL | 225,000 | 110,711 | 2.032 | 789 |
| Philadelphia, PA | 190,000 | 100,921 | 1.883 | 181 |
| Nashville, TN | 170,000 | 92,730 | 1.833 | 84 |
| Columbus, OH | 160,000 | 87,552 | 1.827 | 77 |
| Atlanta, GA | 155,000 | 89,153 | 1.739 | 296 |
| Denver, CO | 180,000 | 103,556 | 1.738 | 160 |
| Washington, DC | 225,000 | 129,728 | 1.734 | 831 |
| Cleveland, OH | 145,000 | 87,458 | 1.658 | 107 |
| Salt Lake City, UT | 160,000 | 98,755 | 1.620 | 90 |
| Boston, MA | 225,000 | 139,801 | 1.609 | 417 |
| Los Angeles, CA | 225,000 | 143,473 | 1.568 | 636 |
| Kansas City, MO | 125,000 | 83,787 | 1.492 | 95 |
| San Francisco, CA | 225,000 | 154,111 | 1.460 | 311 |
| Cincinnati, OH | 132,500 | 91,318 | 1.451 | 74 |
| Miami, FL | 162,500 | 113,065 | 1.437 | 186 |
| Milwaukee, WI | 135,000 | 94,801 | 1.424 | 71 |
| Birmingham, AL | 115,000 | 85,105 | 1.351 | 78 |
| Omaha, NE | 110,000 | 84,540 | 1.301 | 69 |
| Phoenix, AZ | 125,000 | 99,132 | 1.261 | 75 |
| Orlando/Winter Park, FL | 101,000 | 85,293 | 1.184 | 56 |
| New Orleans, LA | 117,500 | 106,569 | 1.103 | 52 |
| Tampa, FL | 100,000 | 91,600 | 1.092 | 87 |
| Pittsburgh, PA | 100,000 | 92,542 | 1.081 | 96 |
| Oklahoma City, OK | 80,000 | 76,538 | 1.045 | 63 |
| Irvine, CA | 160,000 | 154,205 | 1.038 | 112 |
| Sacramento, CA | 120,000 | 116,548 | 1.030 | 84 |
| Seattle, WA | 140,000 | 136,130 | 1.028 | 132 |
| Raleigh, NC | 90,000 | 89,247 | 1.008 | 82 |
| New York City, NY | 225,000 | 225,000 | 1.000 | 2,526 |
| San Diego, CA | 130,000 | 138,766 | 0.937 | 135 |
Note: Cities with at least 50 private practice salaries reported for the Class of 2025 are included in the table.
Sources: Cost-of-living information comes from the Council for Community & Economic Research (C2ER) and its calendar year 2025 Cost of Living Index. Median law firm salary data is from NALP's Jobs & JDs, Class of 2025.
Chart 1. Salary Required to Yield New York City Median Salary ($225k) Buying Power